> For the complete documentation index, see [llms.txt](https://book.ferro.pro/llms.txt). Markdown versions of documentation pages are available by appending `.md` to page URLs; this page is available as [Markdown](https://book.ferro.pro/devops/grafana_cloud.md).
# Grafana\_Cloud
* [Price](#price)
* [Grafana](#grafana)
* [Loki Logs](#loki-logs)
* [Tempo Traces](#tempo-traces)
* [k6 Testing](#k6-testing)
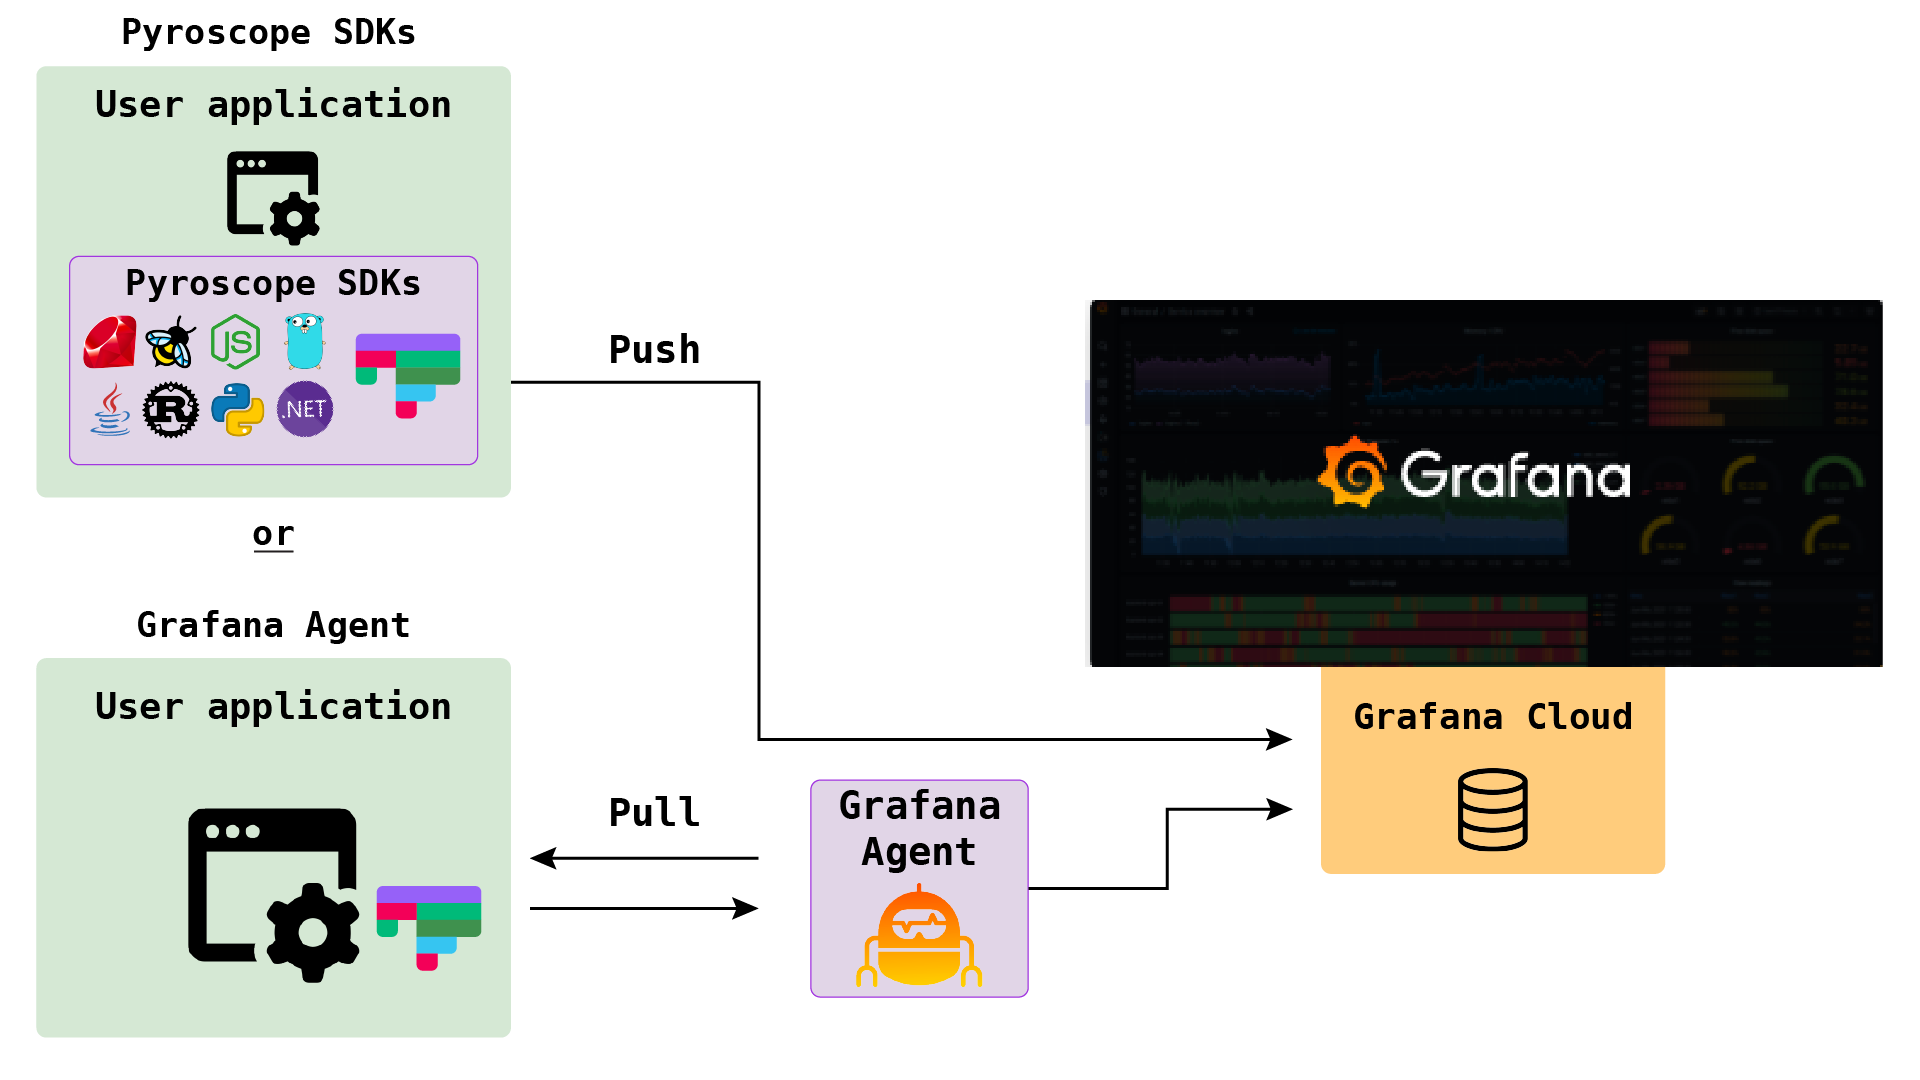
* [Pyroscope Profiles](#pyroscope-profiles)
## Price
* Free: Grafana + Loki + Tempo + K6 + Pyroscope | 10k c
* Pro: Prometheus + Graphite + Alerts
## Grafana
* Free 3 Monthly Active Users
Grafana Agent Role: `grafana.grafana.grafana_agent`
*
## Loki Logs
* Free 50 GB Logs
## Tempo Traces
Free 50 GB Traces
## k6 Testing
* Free 500 k6 Virtual User Hours
*
## Pyroscope Profiles
* Free 50 GB Profiles